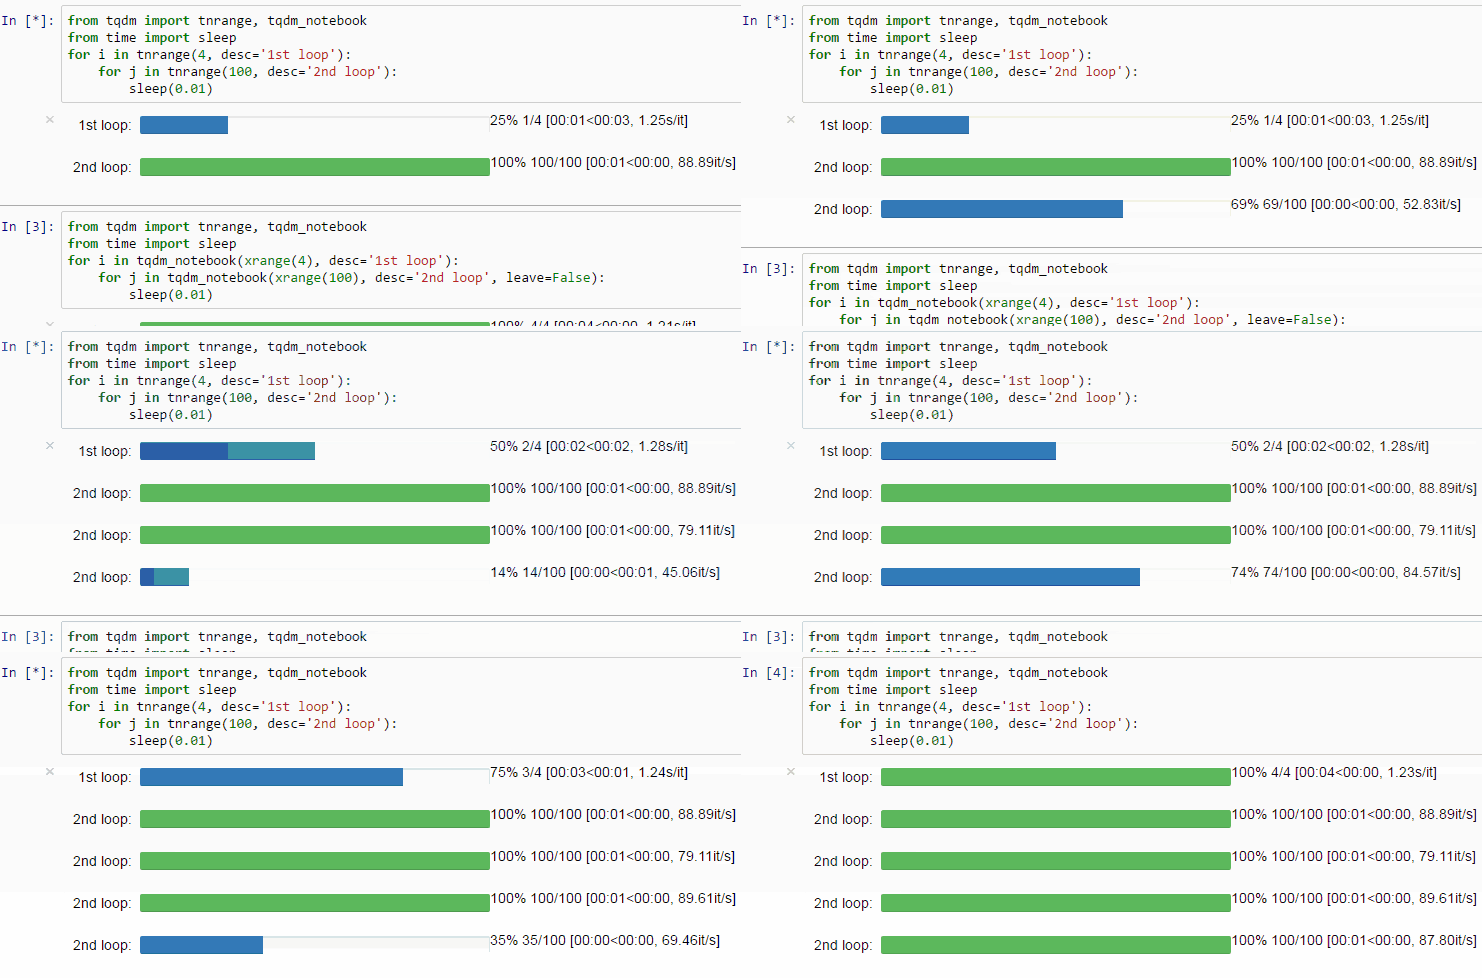
Progress Bars in Python
Originally published in Towards Data Science.
Just like a watched pot never boils, a watched for loop never ends. When dealing with large datasets, even the simplest operations can take hours. Progress bars can help make data processing jobs less of a headache because:
- You get a reliable estimate of how long it will take.
- You can see immediately if it’s gotten stuck.
The first of these is especially valuable in a business environment, where having a solid delivery estimate can make you look super professional. The best/only way I’ve found to add progress bars to Python code is with tqdm. While it is super easy to use, tqdm can be a bit finnicky to set up, especially if you use JupyterLab (which you totally should).

After trawling StackOverflow and some trial and error, I think I’ve found a surefire way to get tqdm up and running (even with JupyterLab)!
Setting up tqdm
First, install tqdm with your package manager of choice (pip, pipenv, anaconda etc). Once it’s installed, you can activate the ipywidgets plugin for JupyterLab by running,
> pip install ipywidgets
> jupyter nbextension enable --py widgetsnbextension
> jupyter labextension install @jupyter-widgets/jupyterlab-manager
To activate tqdm in a notebook you just need to add a cell with,
%%capture
from tqdm import tqdm_notebook as tqdm
tqdm().pandas()
If you’re just going to be using tqdm in a script, you can skip both of these steps!
Using tqdm
You can get a progress bar for any iterable by wrapping it with tqdm(). For example,
my_list = list(range(100))

for x in tqdm(my_list):
    pass
will give you a (very fast) progress bar. You also use tqdm more explicitly,
my_list = list(range(100))

with tqdm(total=len(my_list)) as pbar:
    for x in my_list:
        pbar.update(1)
There’s also a pandas integration,
df.progress_apply(lambda x: pass)
For more on using tqdm, including things like nested progress bars, check out their documentation.